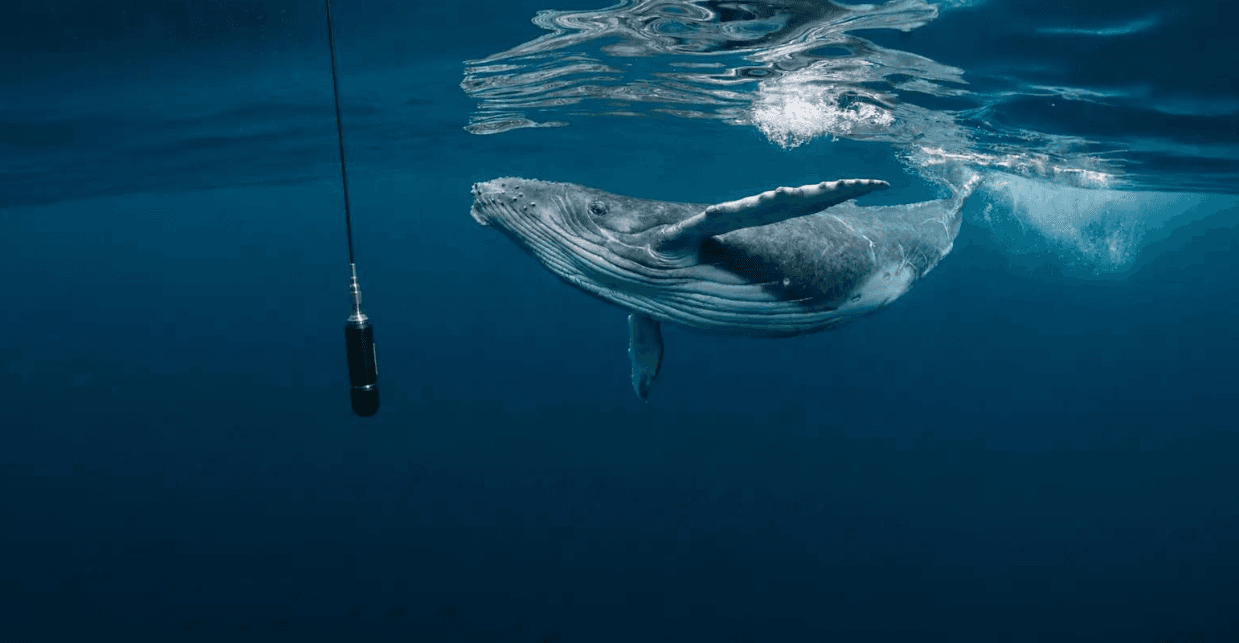
How Do Scientists Compare the Acoustic Patterns of Different Humpback Whale Song Sections?
Humpback whales produce some of the most complex vocal displays in the ocean. Their songs contain distinctive sounds arranged into recurring sequences, and these patterns can vary across recordings. To investigate those differences, scientists compare the acoustic characteristics of individual song sections rather than relying only on general impressions of how a recording sounds.
Comparing humpback whale song patterns helps researchers investigate vocal variation, song organization, and changes in whale communication over time. It can also support studies of similarities between recordings collected at different locations.
For people interested in Samaná whale watching in the Dominican Republic, this research provides another perspective on humpback whales. While visitors may observe whales at the surface, scientists can use underwater recordings to investigate the acoustic patterns that are otherwise difficult to observe directly.
Why Compare Different Humpback Whale Song Sections?
Identifying a song section is only the first step in acoustic research. Once researchers have classified a section, they can ask how it differs from other sections and whether those differences are consistent.
For example, two sections might have similar overall shapes but differ in frequency range, duration, or the timing of repeated sounds. Another pair might contain similar individual units but arrange them in a different order.
Systematic comparison helps researchers:
- Measure similarities and differences between acoustic patterns.
- Identify recurring features in whale vocalizations.
- Examine whether song sections vary between recordings.
- Investigate changes across observation periods.
- Compare song patterns recorded in different locations.
- Build datasets for statistical and computational analysis.
These comparisons describe acoustic evidence. They do not automatically establish the meaning of a song or explain why a whale produces a particular pattern.
1. Comparing Frequency Patterns
Frequency is one of the most important characteristics scientists examine when comparing underwater sounds. It describes how rapidly a sound wave oscillates and is commonly expressed in hertz (Hz).
Researchers may measure the starting frequency, ending frequency, minimum frequency, maximum frequency, and overall frequency range of a song section.
Some sounds rise in frequency over time, while others fall or remain relatively stable. Scientists can compare these contours to determine whether two sounds have similar shapes.
For example, two illustrative sounds might both begin at a lower frequency and rise toward a higher one. If their contours are similar, they may be considered acoustically related under the study's criteria. If one rises sharply and the other changes only slightly, the difference may be meaningful for classification.
Researchers must also consider recording equipment, background noise, and signal quality because these factors can influence the apparent characteristics of a sound.
2. Measuring the Duration of Song Sections
Duration describes how long an acoustic event lasts, from its identified beginning to its end.
Scientists can measure the duration of individual units, phrases, or larger sections, depending on the research question. They may then compare the measurements across multiple examples.
Suppose two phrases contain similar sounds, but one lasts longer because its components are repeated more often. That difference may reflect a change in repetition rather than a change in the sound units themselves.
Researchers should therefore avoid relying on duration alone. A longer phrase is not necessarily a different phrase, and two phrases with similar durations may have very different acoustic structures.
Consistent rules for identifying the beginning and end of each section are essential for reliable comparisons.
3. Comparing Rhythm and Timing
Rhythm describes the timing and spacing of sounds within a sequence. Scientists can investigate the intervals between units, the length of pauses, and the regularity of repeated elements.
Two song sections may contain similar acoustic units but differ in how quickly those units occur.
Researchers can measure the time between successive sounds and calculate averages or examine the variability of those intervals. They may also compare the placement of pauses within a phrase.
Timing measurements help distinguish patterns that sound broadly similar but have different temporal organization.
However, researchers must account for natural variation. A single unusual interval does not necessarily mean that a whale has produced a new song pattern.
4. Using Spectrograms to Compare Song Patterns
A spectrogram displays the frequency content of a sound over time. It provides a visual representation that can help researchers compare acoustic features that are difficult to describe through listening alone.
Scientists can examine spectrograms for:
- Changes in frequency over time.
- Repeated tonal patterns.
- Harmonic structures.
- Pulse sequences.
- Differences in signal duration.
- Similarities in the shape and arrangement of acoustic components.
For meaningful comparison, researchers should use appropriate and documented analysis settings. Different window sizes, frequency resolutions, and filtering choices can affect the appearance of a spectrogram.
A visual resemblance is useful evidence, but it is not sufficient by itself to prove that two sections are identical or have the same biological function.
5. Comparing the Sequence of Acoustic Units
Song sections differ not only in their individual sounds but also in how those sounds are organized.
Researchers may represent a sequence using labels assigned to previously classified units. For example, an illustrative sequence could be A–B–C–B, while another might be A–C–B–B.
The two sequences share some components but arrange them differently.
Scientists can compare the order of units, their repetition rates, and the frequency with which certain transitions occur. These comparisons help describe structural differences even when the individual sounds are similar.
Such labels are analytical tools. They are not literal words or evidence that the whale follows a human-like language system.
6. How Statistical Analysis Helps
When researchers have many recordings, manually comparing every detail becomes difficult. Statistical methods can summarize the differences and help determine whether observed patterns are consistent across a dataset.
For example, scientists might calculate the average duration of a particular type of section, measure the variability in its frequency range, or compare the distribution of timing intervals between groups of recordings.
Depending on the data and research question, they may use:
- Descriptive statistics to summarize acoustic measurements.
- Correlation measures to examine relationships between features.
- Clustering methods to group acoustically similar examples.
- Classification models to assign recordings to defined categories.
- Distance measures to quantify how different two patterns are.
No single statistical method is appropriate for every study. Researchers must choose techniques that match their data, account for uncertainty, and avoid treating multiple recordings of the same event as completely independent observations.
7. Can Computer Software Recognize Similar Song Patterns?
Computer-assisted analysis can help scientists examine large collections of underwater recordings. Software can extract acoustic features, identify candidate sound events, and compare patterns across many samples.
Some approaches represent sounds as numerical feature vectors. Others compare time-frequency representations or use machine-learning models trained on annotated examples.
These methods can make large-scale analysis more efficient, but their results depend on data quality and appropriate validation.
A model trained on clean recordings may perform poorly when exposed to boat noise or overlapping whale vocalizations. It may also misclassify unfamiliar patterns that were not well represented in its training data.
Researchers should test automated results against expert-reviewed examples and report limitations rather than assuming that a computer-generated similarity score provides a definitive answer.
8. How Do Scientists Decide Whether Two Sections Are Similar?
Similarity depends on the research question and the features selected for comparison.
If researchers are studying frequency contours, two sections with comparable contour shapes may be considered similar even if their durations differ. If they are studying rhythm, timing may be more important than the exact frequency range.
A robust comparison therefore defines its criteria before drawing conclusions.
Scientists may compare several features together, such as frequency, duration, rhythm, and unit order. They can then evaluate whether the overall pattern supports a conclusion of strong, moderate, or weak similarity.
Importantly, acoustic similarity does not always mean that two sections have the same origin. Similar patterns may arise independently, reflect shared vocal traditions, or appear similar because of limitations in the recording or classification process.
Further evidence is required to investigate those possibilities.
9. Comparing Song Sections Across Time
Researchers can compare recordings collected on different dates to investigate whether particular acoustic features remain stable or change.
For example, they might measure whether a section's average duration changes across observation periods, whether its frequency contour becomes more variable, or whether its position within a larger sequence shifts.
Long-term comparisons can reveal patterns that would not be apparent from one recording alone.
However, researchers need to distinguish genuine vocal changes from differences caused by equipment, recording locations, background noise, or analysis methods. Standardized procedures and documented metadata make comparisons more reliable.
A difference between two recordings does not necessarily indicate that the whale has learned a new pattern or intentionally changed its song.
10. Comparing Songs From Different Locations
Scientists may also compare song sections recorded in different regions. This can help investigate geographic variation and possible similarities between whale groups.
For a useful comparison, researchers need recordings that are sufficiently clear and comparable, along with information about when and where they were collected.
They should consider whether the same classification system was used and whether differences in equipment or recording conditions could affect the results.
If two regions share similar song patterns, that observation may motivate further research into song traditions and vocal learning. It does not, on its own, establish how the similarity developed or whether whales moved directly between the locations.
How Does This Research Relate to Samaná Bay?
Samaná Bay in the Dominican Republic is a recognized seasonal destination for humpback whale watching. Observing whales at the surface provides valuable information about visible behavior, while underwater acoustic recordings can reveal vocal activity that cannot be assessed through sight alone.
Researchers could apply acoustic comparison methods to suitable recordings collected in and around Samaná Bay. They might investigate the frequency, timing, duration, or sequence of song sections and compare those measurements across observation periods.
Reliable local conclusions would require actual recordings, clear documentation of collection conditions, and a consistent analytical method. It would be inappropriate to claim that a specific song pattern has been documented in Samaná Bay without supporting research evidence.
For visitors, understanding this scientific process highlights how whale research extends beyond counting sightings or photographing tail flukes. Acoustic data can provide another way to investigate the lives of these migratory marine mammals.
Common Challenges When Comparing Whale Song Patterns
Acoustic comparison is not always straightforward. Researchers must consider several sources of uncertainty.
Background noise: Boat engines, waves, and other sounds can mask acoustic features.
Overlapping vocalizations: Multiple whales may vocalize at the same time, making individual patterns difficult to separate.
Natural variation: A whale may produce slightly different versions of a recurring sound.
Incomplete sequences: Recordings may capture only part of a song section, limiting the features available for comparison.
Differences in equipment: Hydrophones and recording systems may have different frequency responses or sensitivities.
Subjective classification: Analysts may disagree about where one section ends or how an ambiguous sound should be categorized.
Careful study design, standardized procedures, transparent reporting, and independent review can help reduce these problems.
Frequently Asked Questions
What features do scientists compare in humpback whale songs?
They may compare frequency contours, duration, rhythm, pauses, repeated units, and the order of sounds within a section.
Are spectrograms enough to prove that two song sections are identical?
No. Spectrograms help visualize acoustic similarities, but researchers should also consider quantitative measurements, recording conditions, and uncertainty.
Can two song sections sound similar but still be different?
Yes. They may share frequency patterns while differing in timing, duration, repetition, or sequence structure.
Does acoustic similarity prove that whales learned a song from each other?
No. Similarity alone cannot establish how a pattern originated or spread. Researchers need additional evidence to investigate vocal learning and social transmission.
Can scientists compare whale songs recorded in different years?
Yes, provided that recordings and analytical methods are sufficiently comparable. Researchers must consider changes in equipment, recording conditions, and classification procedures.
Can whale song comparisons help protect humpback whales?
They can contribute to understanding vocal behavior and the acoustic environments whales use. Such findings may inform broader research and conservation discussions, although any management recommendation should be supported by appropriate evidence.
Conclusion
Comparing humpback whale song patterns involves measuring and evaluating several acoustic features, including frequency, duration, rhythm, and the arrangement of individual sounds. Spectrograms, statistical analysis, and computer-assisted methods can help researchers identify similarities and differences across recordings.
Reliable conclusions depend on clear classification rules, comparable data, and careful treatment of uncertainty. Acoustic similarity can reveal useful patterns, but it does not automatically explain what a whale's song means or how a particular vocal tradition developed.
For those interested in Samaná whale watching, this research offers a deeper understanding of how scientists study humpback whale communication. With suitable recordings and well-designed analyses, acoustic comparisons can help expand knowledge of these remarkable animals.

Local explorer & expert guide in Saona Island Beach.